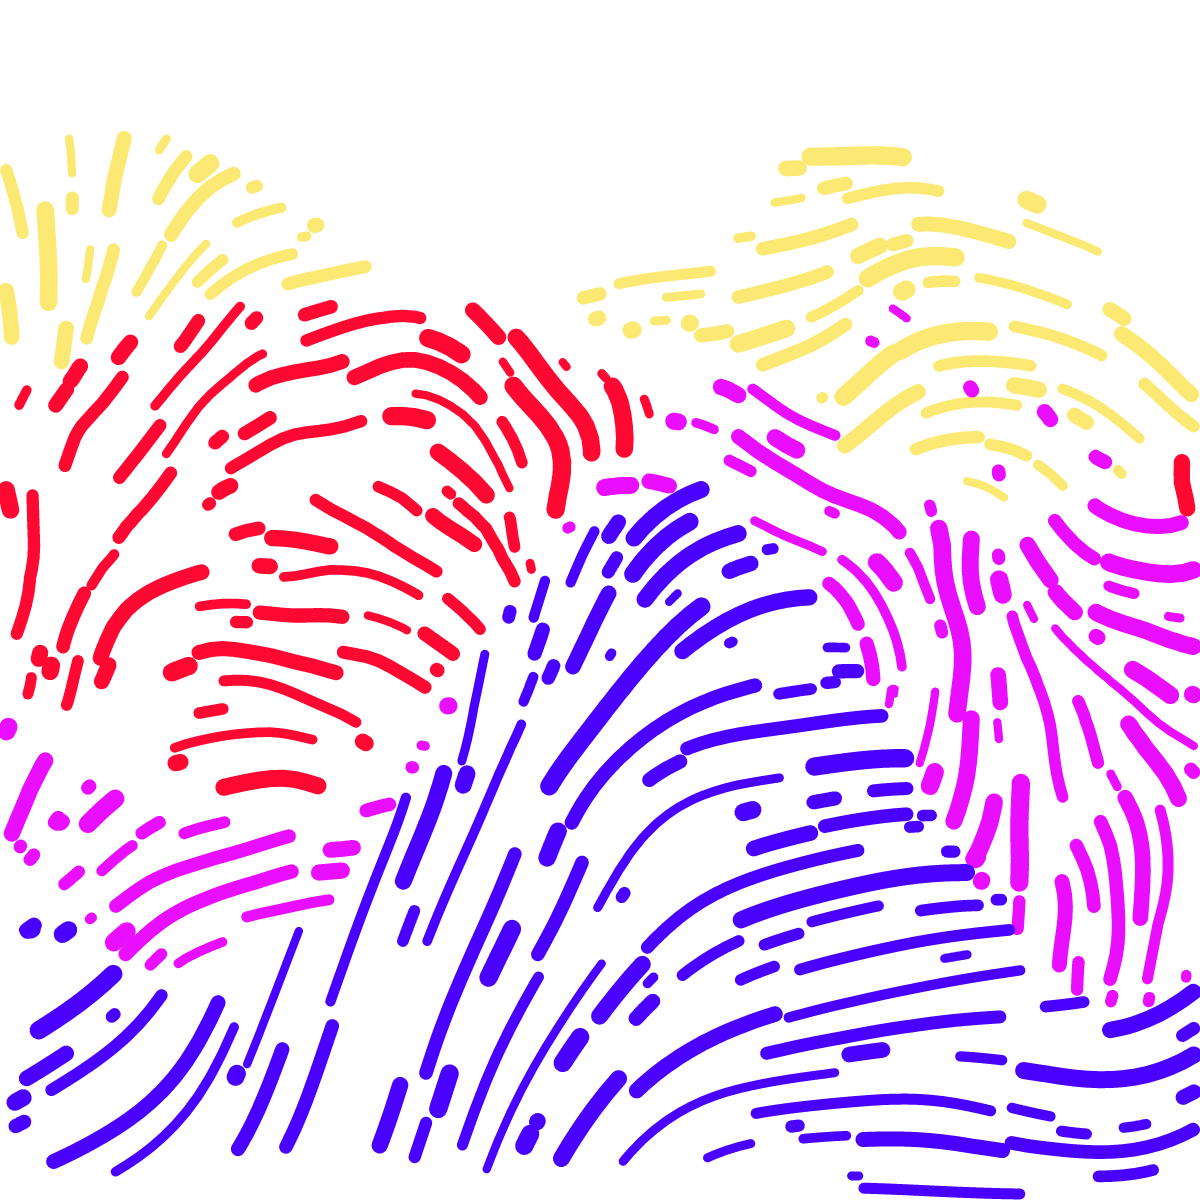
Entropy
 campyoutsider1/1
Data-driven polar scatter chart
There is an underlying dataset generating the chart. Number of elements rendered depends on the hash value.
5 color palettes
3 element fill types (all transparent, semi-filled, all filled)
2 types: single (same sized elements), binned (irregular sized elements, where values are grouped according to a random threshold before render)
This page has been generated using fx_hash public API https://api.fxhash.xyz/graphql/, to display an overview of a creator's collection from www.fxhash.xyz. The computation of "rarity" is not the official computation and therefore can differ. Dev by @zancan.